A Practical Guide to SEO Key Performance Indicators
So, what exactly are SEO key performance indicators (KPIs)?
Think of them as the gauges on your digital dashboard. They are the specific, measurable numbers that tell you if your search engine optimization efforts are actually hitting your business goals. In short, they show you what’s working, what’s not, and where your biggest opportunities are hiding.
Why Your Business Needs SEO KPIs
Ever tried to fly a plane without any instruments? You might feel like you're moving forward, but you have no clue about your altitude, speed, or direction. Running an SEO strategy without KPIs is exactly like that—you're busy, but you're flying completely blind.
SEO KPIs turn vague goals like "get more traffic" into a clear, measurable flight plan. They're the critical link connecting your daily tasks—like publishing a blog post or building a new link—directly to tangible business outcomes, whether that's generating leads or ringing up sales.
Differentiating Actionable KPIs from Vanity Metrics
It's all too easy to get distracted by numbers that look impressive on the surface but don't actually move the needle for your business. We call these vanity metrics. A massive spike in impressions might give you a warm feeling, but if nobody is clicking, it’s not doing you any good.
Actionable KPIs, on the other hand, are tied directly to your business objectives. They deliver the insights you need to make genuinely smart decisions.
- Vanity Metric: A sudden surge in social media shares for a blog post. It looks great, but it might not translate into a single new customer.
- Actionable KPI: An increase in the organic conversion rate for that same blog post. Now that shows your content is attracting the right people and convincing them to take action.
A metric tells you what happened. A KPI tells you if what happened actually mattered to your business. It's the bridge between raw data and real strategy.
This map below gives you a great visual of how day-to-day SEO activities produce KPIs that directly feed into your main business goals.
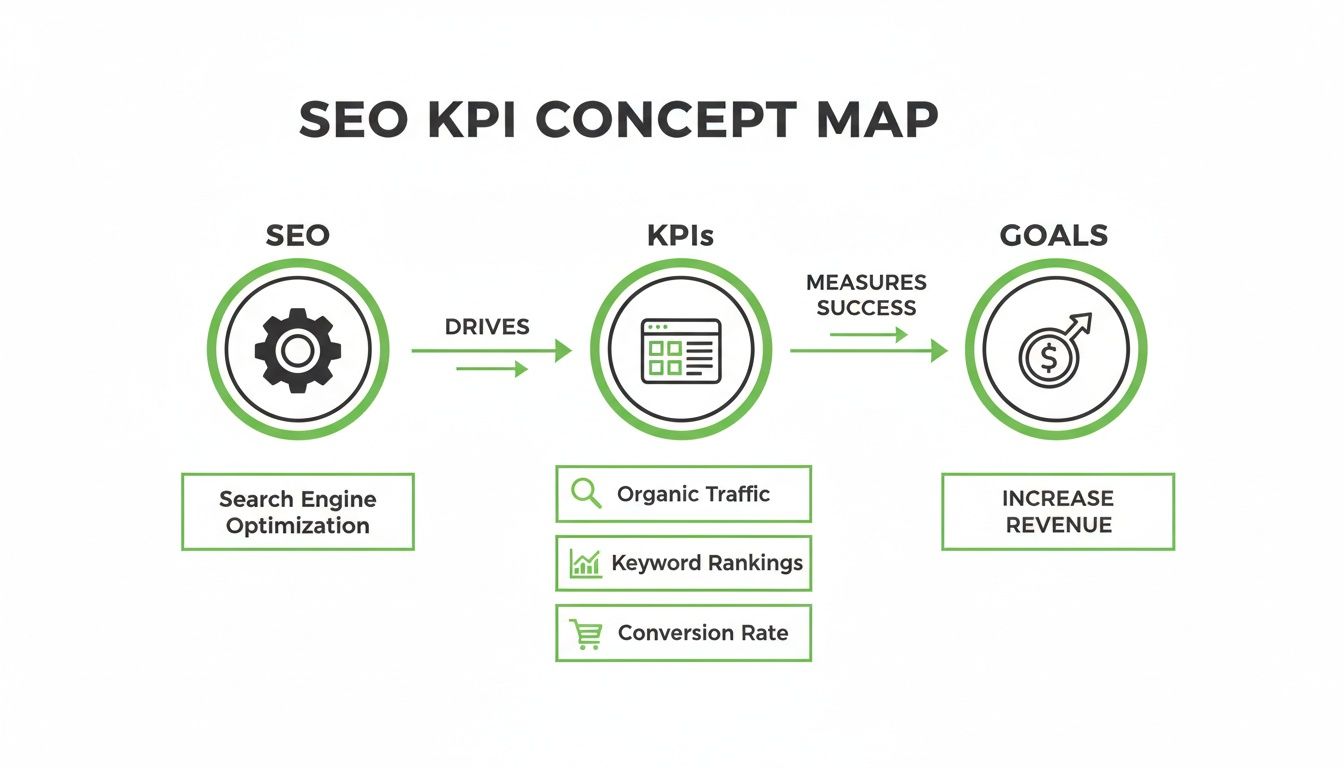
As you can see, tracking the right performance indicators is non-negotiable if you want to turn your SEO work into measurable revenue.
Setting the Foundation for Success
By defining your KPIs before you start, you're essentially building a framework for success. This framework helps you pour your resources into the activities that promise the best returns and makes it much easier to show the value of your SEO investment to stakeholders. A solid understanding of how to analyze content performance is a core part of this, as it forces you to set clear goals and track the metrics that truly matter.
Ultimately, choosing the right SEO key performance indicators is what turns abstract data into your most powerful strategic asset. If you're looking to scale your content, getting a handle on the fundamentals of analytics is the perfect place to start. You can dive deeper into this in our guide to programmatic SEO analytics and measurement.
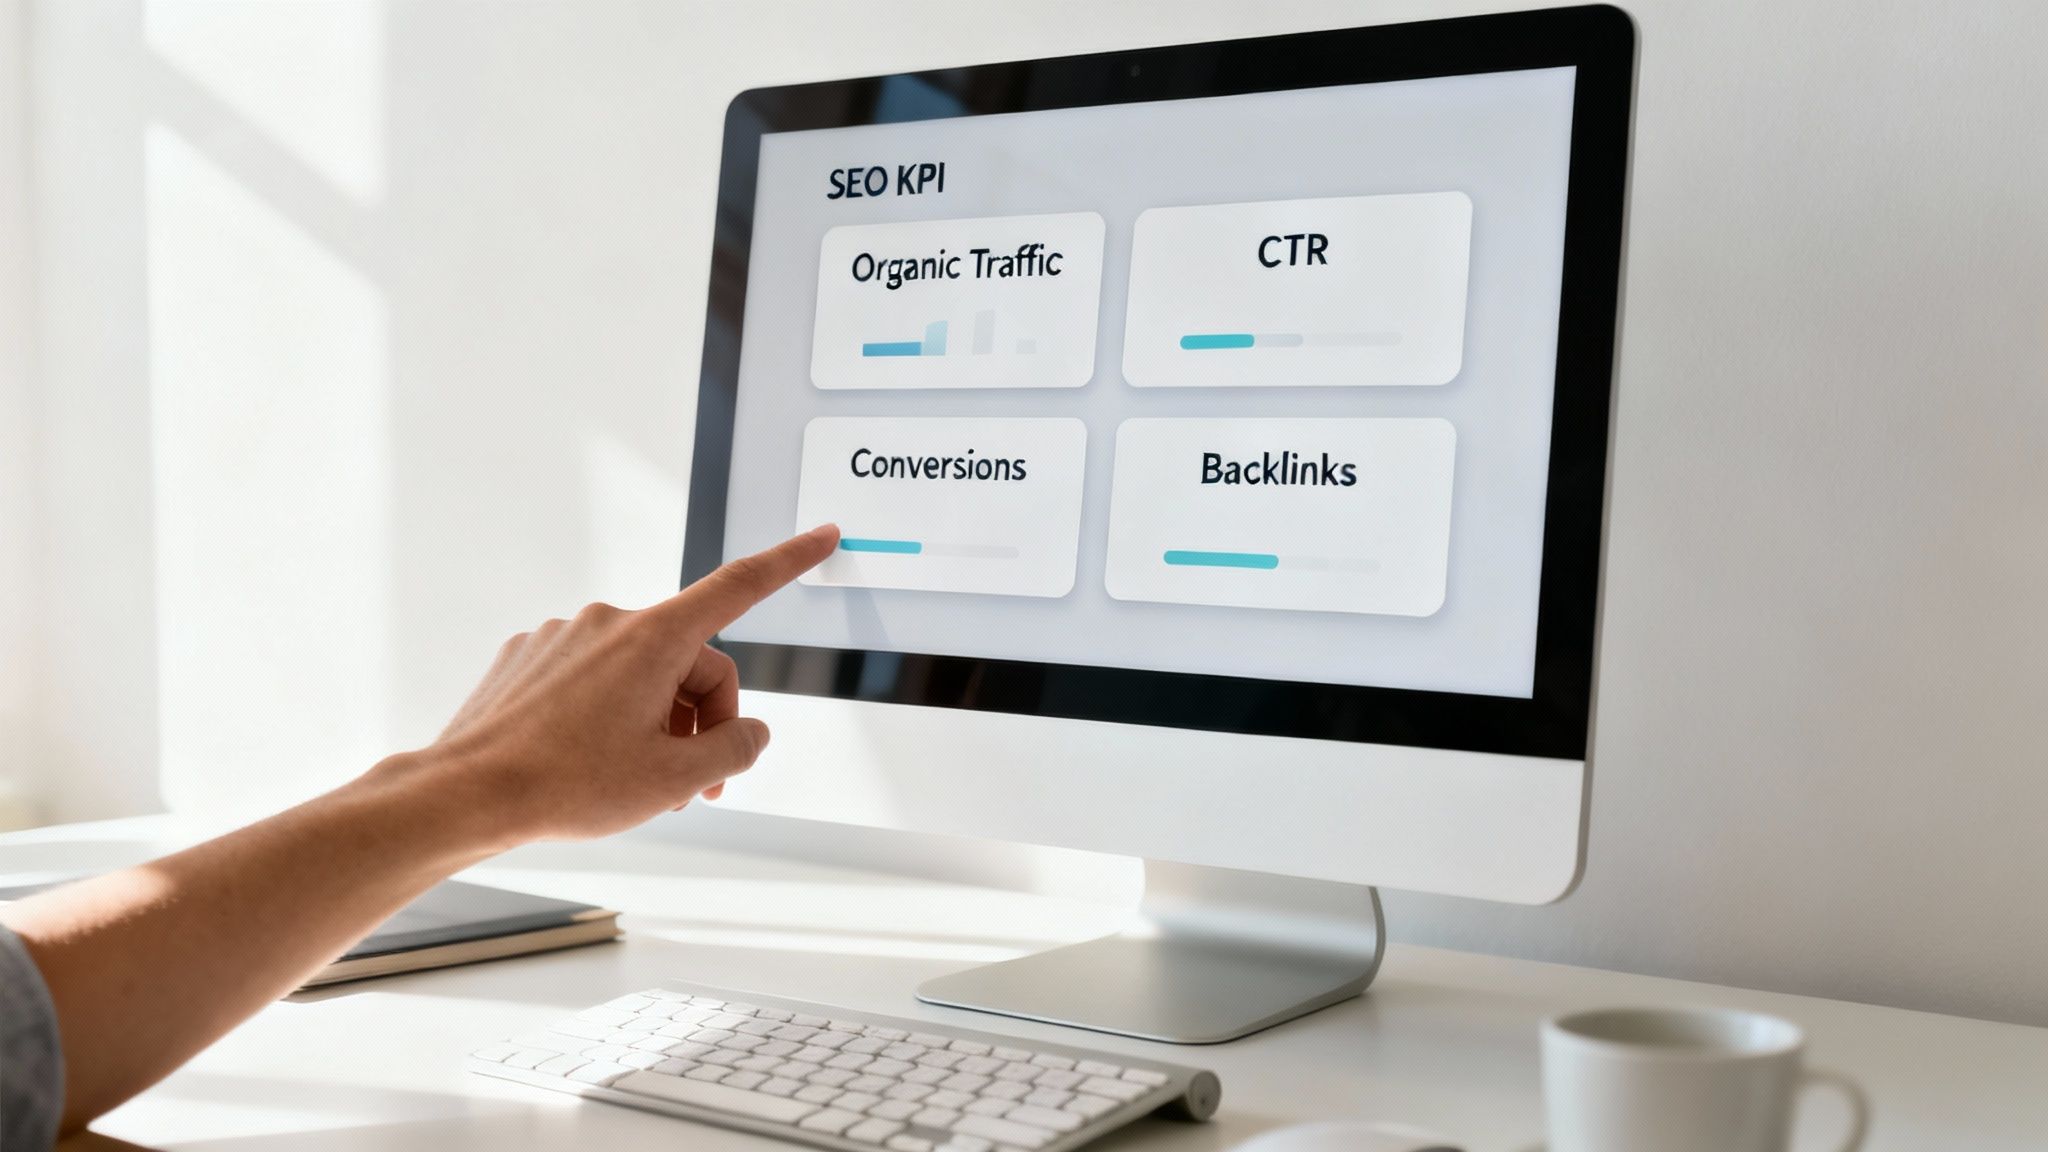
Tracking Your Visibility and Organic Traffic
This is where the rubber meets the road. To get a real sense of your SEO performance, you first have to measure how visible you are online and how many people are actually finding you through a simple search. These initial SEO key performance indicators are your first clues, telling you whether you're even heading in the right direction.
Organic Traffic: The Lifeblood of Your Presence
Think of organic traffic as the stream of potential customers walking through your digital front door, all coming from search engines. This isn't just a vanity metric; it represents real people who were actively looking for an answer or a solution and landed on your site. This KPI is absolutely vital because it’s a direct measure of how well your content is pulling in an interested audience—without you having to pay for every single click.
You can find this data right in Google Search Console under the "Performance" tab by looking at "Total clicks." A steady climb in organic traffic over time is one of the clearest signs that your SEO strategy is paying off and your brand's reach is expanding. To get a really sharp picture of your progress, you might look into specialised tools or chat with visibility tracking agencies who live and breathe this stuff.
For a much deeper look, check out our guide on how to grow your organic traffic through programmatic SEO.
Keyword Rankings: Your Market Share in Search
If organic traffic is the flow of people, then keyword rankings are your slice of the market—your share of the online conversations that matter to your customers. When someone searches for "best running shoes for beginners," the websites that show up on page one effectively own that conversation. Your ranking tells you exactly where you stand.
Keeping an eye on your keyword rankings helps you understand your competitive footing, pinpoint which pages are pulling their weight, and spot new opportunities. You don’t need to lose sleep over daily jumps and dips, but monitoring your position for your most valuable keywords is non-negotiable. You can track this in Google Search Console by filtering the "Queries" report or by using a dedicated rank-tracking tool.
Think of keyword rankings like owning digital real estate. The higher you rank on the search results page, the more valuable and visible your property becomes to potential customers passing by.
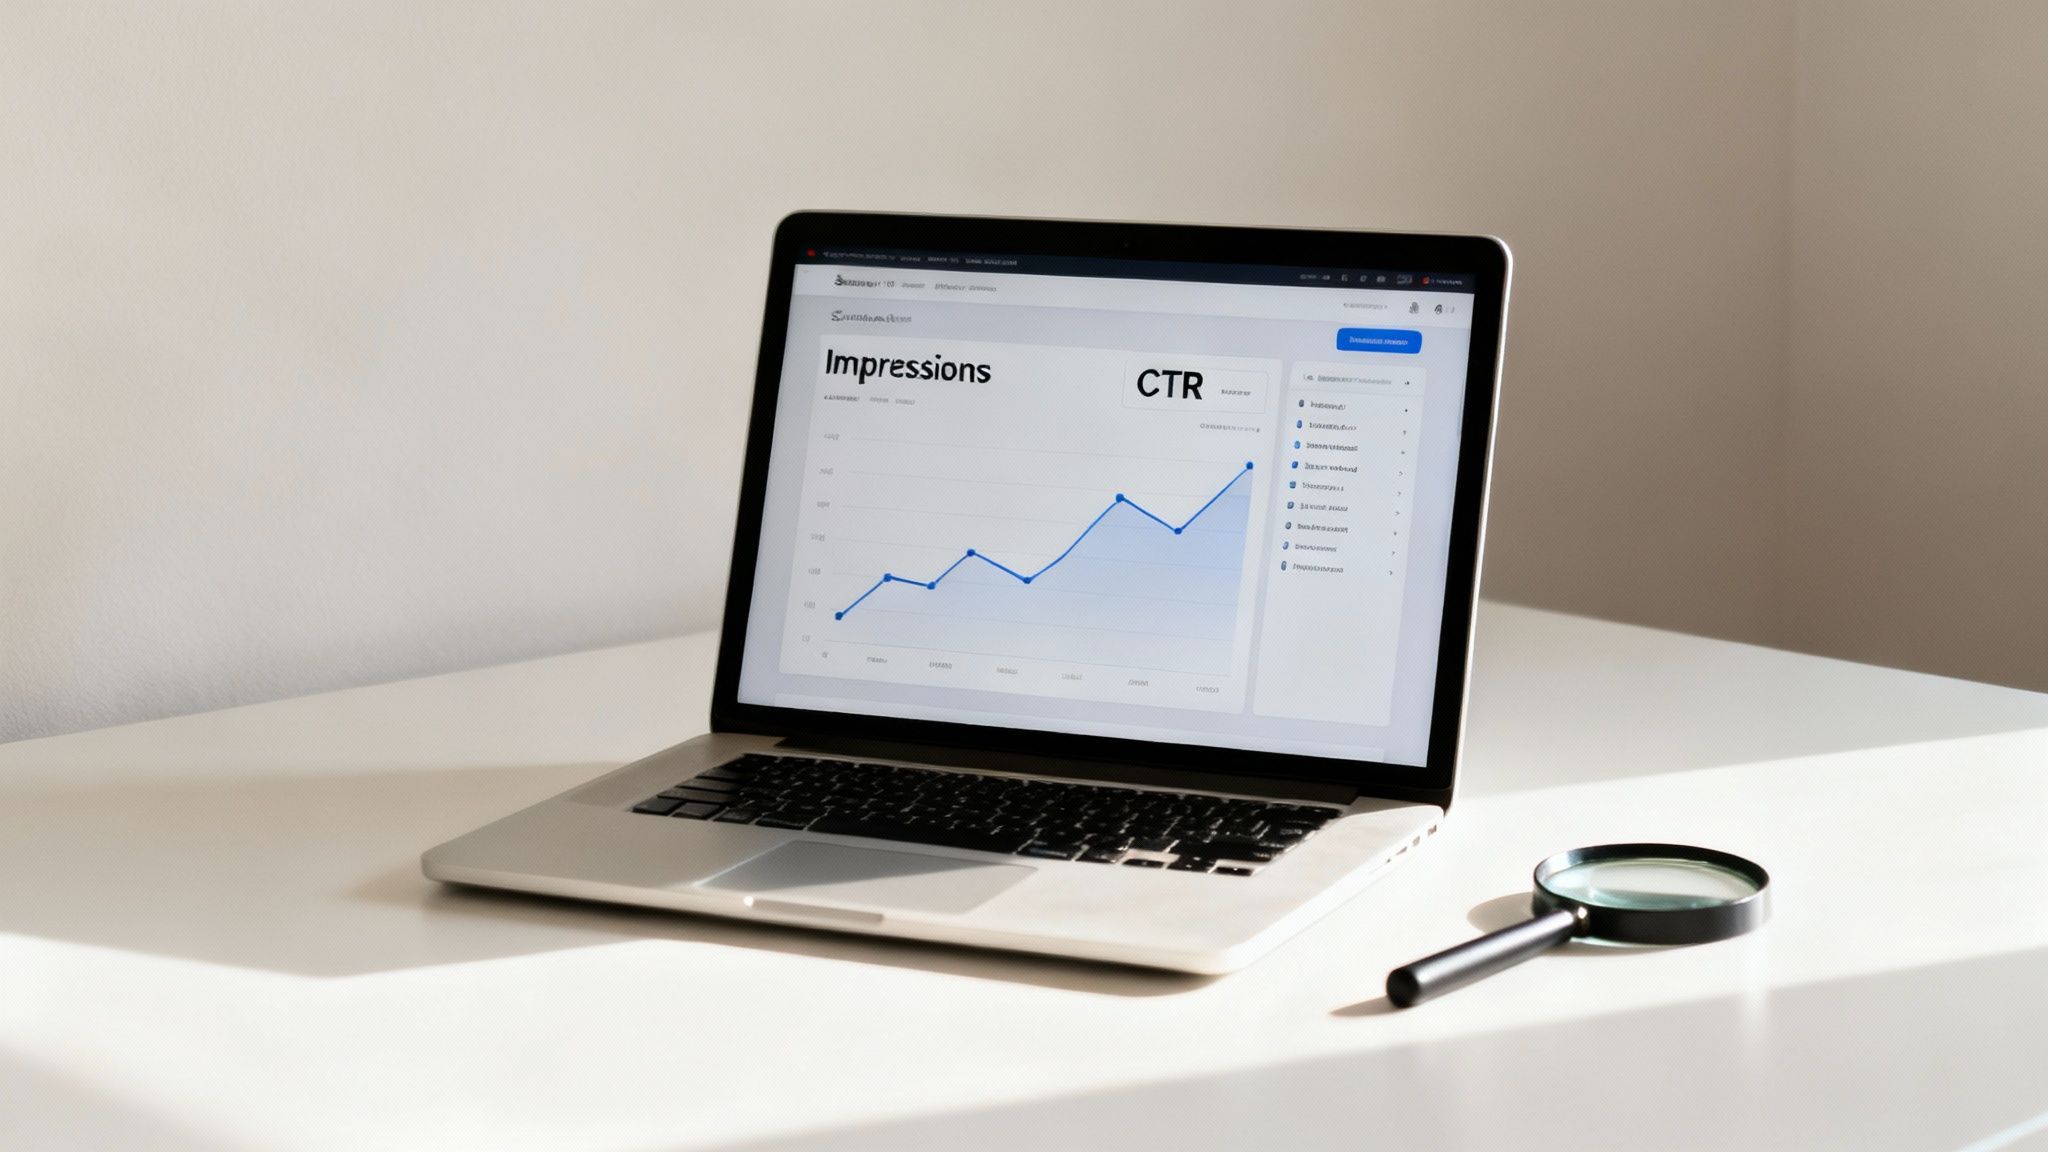
Impressions and CTR: Your Storefront Window
Finally, let's talk about Impressions and Click-Through Rate (CTR). Picture your website as a brick-and-mortar shop in a bustling shopping centre.
- Impressions are the total number of people who walk past your shop window (your listing in the search results). It tells you how often your site is even being shown to searchers.
- Click-Through Rate (CTR) is the percentage of those people who actually decide to step inside. It measures how compelling your "window display"—your page title and meta description—really is.
A ton of impressions but a really low CTR could mean your title just isn't grabbing anyone's attention or doesn't match what the searcher was hoping to find. On the flip side, a high CTR shows you’ve nailed it, creating a relevant and enticing snippet that begs to be clicked. Both of these metrics are sitting right there for you in Google Search Console's "Performance" report.
To wrap up this foundational set of metrics, here’s a quick-glance table summarising these core KPIs.
Core Visibility and Traffic KPIs at a Glance
| KPI | What It Measures | Why It Matters | Where to Track It |
|---|---|---|---|
| Organic Traffic | The number of visitors who arrive at your website from search engines without paid ads. | It's the primary indicator of your overall SEO success and content relevance. | Google Analytics, Google Search Console |
| Keyword Rankings | Your website's position in search results for specific, targeted keywords. | Shows your market share for key topics and highlights competitive strengths/weaknesses. | Google Search Console, Ahrefs, Semrush |
| Impressions | The total number of times your URL appeared in search results for users. | Measures your potential reach and overall visibility in search. | Google Search Console |
| Click-Through Rate (CTR) | The percentage of impressions that resulted in a click to your website. | Gauges how compelling and relevant your search snippet (title/description) is. | Google Search Console |
These four KPIs—Organic Traffic, Keyword Rankings, Impressions, and CTR—form the bedrock of SEO measurement. Together, they give you a clear and actionable view of just how visible you really are online.
Connecting SEO to Conversions and Revenue
Big traffic numbers look great on a chart, but they don't keep the lights on. The real measure of any SEO strategy is whether it actually moves the needle for the business. This is where we close the gap between website visits and your bottom line, focusing on the SEO key performance indicators that prove you’re delivering real value.
These are the KPIs that elevate SEO from a marketing expense to a predictable revenue driver. They give you the undeniable proof that your work is directly fuelling the company's growth.
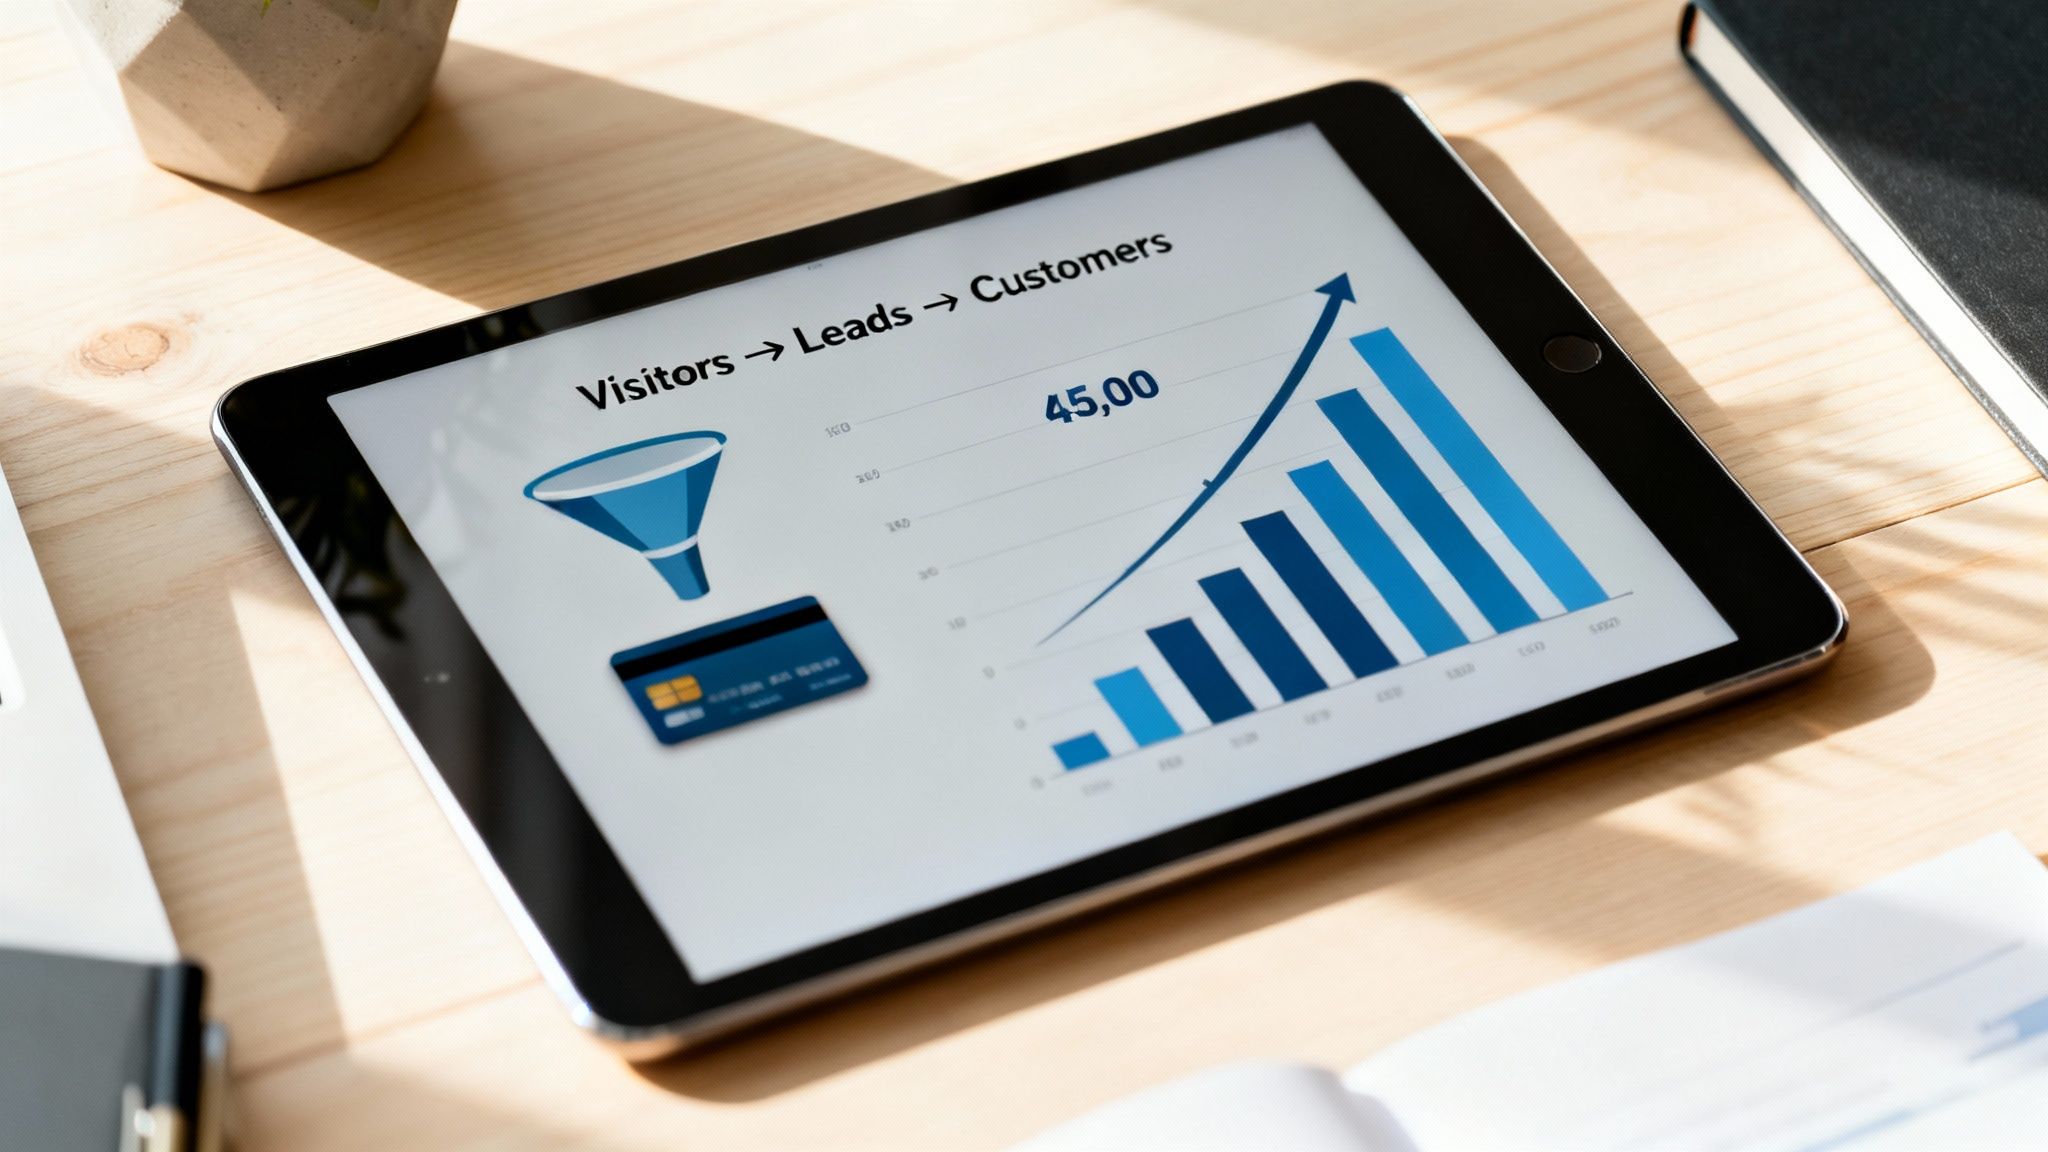
From Clicks to Customers with Conversion Rate
The most direct line you can draw from traffic to business impact is your Conversion Rate. At its core, it's just the percentage of your organic visitors who take an action you care about. It answers the simple, critical question: "Of all the people finding us on Google, how many are actually doing something useful?"
And a "conversion" doesn't have to be a purchase. It’s any action that nudges a potential customer down the path.
- Booking a product demo
- Starting a free trial
- Downloading a whitepaper
- Signing up for your newsletter
A rising conversion rate is a fantastic signal. It means you’re not just pulling in more traffic, but you're pulling in the right traffic—people who genuinely need what you offer. For a deeper dive, our guide on conversion tracking in programmatic SEO can help you get this set up.
Tracking Organic Leads and Sales
While Conversion Rate tracks actions, Organic Leads and Sales track the cold, hard cash. These KPIs put a real monetary value on your SEO efforts, making them the most persuasive metrics you can share with any stakeholder.
When you track these, you can confidently say things like, "Our blog content brought in 50 qualified leads last month," or "Improving our rank for 'X' keyword resulted in a €10,000 bump in sales." This is how you demonstrate an undeniable ROI.
Tying specific organic traffic sources directly to sales is the holy grail of SEO. It changes the conversation from rankings and clicks to revenue and growth—the language every business leader understands.
Seeing the Bigger Picture with Customer Lifetime Value
Finally, one of the most sophisticated but powerful KPIs is Customer Lifetime Value (CLV) from your organic channel. Instead of just looking at the first sale, CLV estimates the total revenue you can expect from a single customer you acquired through SEO over the entire time they do business with you.
This metric is a game-changer because it proves the long-term impact of your work. A customer who found you via search might only make a small purchase at first, but their total value over the next few years could be massive. Understanding this helps justify bigger investments in SEO, proving that attracting the right people pays off for years to come.
How to Start Tracking Conversions in GA4
The good news is you don’t need to be a data scientist to get started. You can begin tracking basic conversions right inside Google Analytics 4 (GA4) by flagging key "events."
- Navigate to Admin: Head to the 'Admin' section (the gear icon) in your GA4 property.
- Find 'Events': Under the 'Property' column, click on 'Events'. You'll see a list of actions users are already taking on your site.
- Mark as Conversion: Look for a high-value event, like 'generate_lead' or 'purchase'. All you have to do is flip the switch for it in the "Mark as conversion" column.
That's it. Once that's enabled, GA4 will start counting how many visitors from organic search complete that action. It's a simple first step, but it's the one that starts connecting your SEO work to real business results.
Understanding User Engagement and Experience
So, you got the click. Great! But Google’s job isn’t over, and neither is yours. What happens after someone lands on your page is where the real SEO magic happens today. Getting them to your site is just the first step; making sure they have a good time is the real test.
This section is all about the SEO key performance indicators that tell Google whether your visitors are happy or heading for the exit.
Think of your website like a brick-and-mortar shop. Are people walking in, glancing around, and immediately walking back out? Or are they sticking around, browsing the aisles, and finding exactly what they were looking for? These user experience signals are what tell search engines if your "shop" is worth sending more customers to.
Key Engagement Metrics to Watch
A handful of core metrics can paint a surprisingly clear picture of how users are interacting with your site. They’re your window into user behaviour, showing you what’s working and what needs a rethink.
Bounce Rate: This is the percentage of people who land on one of your pages and leave without doing anything else—no clicks, no scrolling, nothing. A high bounce rate often means the content just didn't live up to what the searcher expected to find.
Dwell Time: This one’s a bit more subtle. It measures how long a user spends on your page before heading back to the search results. Longer dwell times are a strong signal to Google that your content was valuable and did a good job of answering their question.
Pages per Session: This is simply the average number of pages someone views in a single visit. A higher number is a good sign, suggesting your site is easy to navigate and pulls users deeper into your content.
Even the big players get this wrong. Take DHL's site in Germany, for example. Despite pulling in a massive 108 million visits, it had a bounce rate of 67.74%. That’s a huge chunk of visitors leaving without engaging, highlighting a massive opportunity to improve the user experience.
These aren't just numbers on a spreadsheet; they're direct feedback from your audience. For a deeper dive, check out our guide on why user experience signals in programmatic SEO are so critical.
Demystifying Core Web Vitals
Beyond how people engage with your content, Google also measures the raw technical performance of your site. This is done through a set of specific metrics called Core Web Vitals (CWV). They might sound overly technical, but the ideas behind them are all about user happiness.
Think of Core Web Vitals as the basic hospitality of your website. Is it fast? Is it responsive? Does it stay put? A bad score here is like a shop with a sticky front door, flickering lights, and a wobbly floor—it frustrates people before they even get a chance to see what you’re selling.
Let's break them down into plain English:
Largest Contentful Paint (LCP): How fast does your page load? This basically measures how long it takes for the most important part of your page (like a big image or the main text) to appear. A fast LCP tells the user, "Yep, you're in the right place, and things are working."
Interaction to Next Paint (INP): How quickly does your page respond? This one is all about responsiveness. When a user clicks a button, taps a link, or starts typing, how long does it take for the page to react? A good INP score means your site feels snappy, not sluggish.
Cumulative Layout Shift (CLS): Is your page visually stable? Have you ever tried to click a button, only for an ad to load and push it down, making you click the wrong thing? That’s layout shift. CLS measures how much your content moves around unexpectedly while loading. A low score is a good thing.
Nailing these technical KPIs is non-negotiable in modern SEO. A site that loads fast and feels smooth will keep users engaged, which in turn helps you rank higher. You can easily check your site’s performance for free with tools like Google’s PageSpeed Insights. It gives you a clear report card and tells you exactly what you need to fix.
Your Site's Reputation and Technical Foundation
Trust is everything on the web. For search engines, that trust comes down to two things: your site’s reputation (its authority) and how reliably it works (its technical health). Let’s dig into the KPIs that measure how you're doing in both areas, making sure your digital house is built on solid ground.
These aren't just vanity metrics. They tell you how credible and easy-to-access your site is for search engines. Without a good reputation and a clean bill of technical health, even the best content in the world will struggle to get seen. This becomes especially critical when you're creating content at scale, as small technical problems can quickly spiral out of control.
Gauging Your Site's Authority
Authority isn't some fuzzy, abstract idea in SEO; it’s something you can actually measure. It’s a reflection of how much search engines trust your website as a source of good information, and a huge part of that trust is built by what other websites are saying about you.
Backlinks (Quality Over Quantity): Think of a backlink as a vote of confidence from another website. When a well-regarded site links to your content, it’s basically telling Google that your page is a worthwhile resource. The keyword here is quality. A single link from a major industry publication is far more valuable than a hundred links from irrelevant, low-quality blogs. Keeping an eye on new, high-quality backlinks is a fantastic sign your authority is on the rise.
Domain Authority (and Similar Scores): Tools like Moz, Ahrefs, and Semrush all have their own metrics, like Domain Authority (DA) or Domain Rating (DR). It's important to remember these aren't Google metrics. They are, however, a really useful at-a-glance barometer of your site's overall authority based on its backlink profile. A rising score is great, but it’s best used as a way to benchmark yourself against competitors, not as a goal in and of itself.
A strong backlink profile is like having respected experts in your field recommend your work. The more credible the endorsements, the more trustworthy you appear to everyone, including search engines.
Tracking these authority KPIs helps you figure out where you stand in the broader web ecosystem. A healthy, growing authority score means your content is earning respect and has a much better shot at ranking for those tough, competitive keywords.
Your Site's Technical Health Check-Up
Your website's technical foundation is what allows search engines to find, understand, and ultimately show your pages to people. If that foundation has cracks, nothing else you do really matters. Think of these KPIs as a regular health check-up for your website, helping you catch problems before they become serious disasters.
You can find most of the crucial technical health KPIs inside Google Search Console, a free tool that’s basically a direct line of communication between you and Google.
Indexing Status: This is the most basic technical KPI there is. It answers a simple, vital question: "Are my pages even in Google's database?" The "Pages" report in Google Search Console tells you exactly which of your URLs are indexed and—more importantly—which ones aren't, and why. If your key pages aren't indexed, they are completely invisible in search results. It’s as simple as that.
Crawl Errors: This KPI flags any roadblocks Google’s bots hit while trying to explore your site. Maybe it’s a broken link that leads to a "404 Not Found" error, or a server issue that slams the door shut. Regularly checking for and fixing these crawl errors ensures that search engines have a smooth, clear path to all your great content.
How to Build a Simple SEO KPI Dashboard
Raw data is a bit like a pile of bricks—full of potential, but not much use until you actually build something with it. An SEO KPI dashboard is that structure. It arranges your most critical metrics into a clear, visual story, letting you spot trends and make smart decisions in minutes, not hours.
The goal isn't just to look at numbers. It's about shifting from data overload to decisive action by visualising the KPIs we’ve just gone through. And the best part? You can build a surprisingly powerful dashboard completely for free.
Tools for Your First Dashboard
You don't need fancy, expensive software to get started. A fantastic—and free—tool for this is Looker Studio (what used to be Google Data Studio). It connects straight into your other free Google tools, pulling in all the data automatically.
Here’s what you’ll need to connect:
- Google Analytics 4 (GA4): This is your go-to for traffic, engagement, and conversion data.
- Google Search Console (GSC): This gives you that crucial visibility data like impressions, clicks, and keyword rankings.
By linking these two sources to Looker Studio, you create one central hub where all your key performance indicators live together, always up to date.
Structuring Your Dashboard for Clarity
A great dashboard answers your most important business questions at a glance. So instead of just chucking every metric you can find onto the page, you need to organise it logically. Think of it as telling a story, moving from the big-picture view down to the nitty-gritty details.
Your dashboard should be a conversation starter, not a data dump. Each chart should answer a specific question: Are we more visible this month? Is our best content converting? Where are our biggest opportunities?
Here is a simple, effective structure that anyone can follow. If you want to dive deeper into more advanced layouts, check out our full guide on creating effective SEO dashboards.
Top-Level Performance Overview (The 30,000-Foot View): Start with the big picture. Stick a few "scorecard" widgets right at the top showing your most vital KPIs for the current date range (like the last 30 days).
- Total Organic Traffic
- Total Organic Conversions
- Average Click-Through Rate (CTR)
- Total Impressions
Visibility & Engagement Trends (The Story Over Time): Next, use line charts to show performance over a longer period, like the last 90 days or even a full year. This helps you see momentum and identify any seasonal patterns.
- One chart showing Organic Traffic vs. Conversions.
- Another showing Impressions vs. CTR.
Content & Keyword Performance (The Ground-Level Details): Finally, add a couple of tables that break down what’s actually driving those results.
- A "Top Pages by Organic Traffic" table.
- A "Top Queries by Clicks" table.
This simple layout flows perfectly, taking you from "How are we doing?" to "Why is that happening?" all on one screen.
Common Questions About SEO KPIs
Even with a solid plan, a few questions always pop up when you're getting your hands dirty with SEO key performance indicators. Let's clear up some of the most common ones so you can measure your success with confidence.
What’s the Difference Between a Metric and a KPI?
Think of it this way: a metric is just a number. It's any piece of data you can track, like website visitors or page load time. It's raw information.
A Key Performance Indicator (KPI), on the other hand, is a metric you’ve hand-picked because it directly proves you’re making progress towards a crucial business goal. For example, 'organic traffic' is a metric. But if your main objective is to grow brand awareness, then 'year-over-year organic traffic growth' becomes your KPI.
A metric tells you what happened. A KPI tells you if what happened actually mattered for your business goals. It’s the essential bridge between raw data and real strategy.
In short, all KPIs are metrics, but very few metrics are important enough to be called KPIs.
How Often Should I Check My SEO KPIs?
This really depends on what you're looking at. Trying to watch everything every single day is a surefire way to get stressed out by normal, meaningless fluctuations. A more structured approach is always better.
- Weekly Checks: Leading indicators are perfect for a weekly check-in. This includes things like keyword rankings, organic traffic, and crawl errors. It lets you spot any sudden, major problems without getting lost in the daily noise.
- Monthly or Quarterly Reviews: Lagging indicators—the ones tied to business impact like organic conversions or revenue from search—are best reviewed monthly or quarterly. These numbers need more time to show a meaningful trend.
The most important thing is to get into a consistent rhythm, like checking in on the first Monday of every month. That’s how you start spotting the long-term trends that matter.
What Are the Most Important KPIs for a New Website?
When your website is brand new, the game is all about fundamentals and visibility. Before you can even think about conversions, you need proof that your site is technically solid and that search engines are starting to notice you exist.
For a new site, focus on these critical KPIs first:
- Indexing Status: Are your pages even in Google's database? You can find this right in Google Search Console. No index, no rankings.
- Organic Impressions: Are people seeing your site in the search results at all? This is the very first sign of life.
- Keyword Rankings: Are you starting to show up for your core search terms? It doesn't matter if it's on page five; it means you're in the game.
- Organic Traffic: Finally, are those impressions turning into actual clicks and visitors?
Nailing these four KPIs confirms your technical setup is working and you're officially on the board. Now you can start building some real momentum.
Ready to scale your content strategy with confidence? The Programmatic SEO Hub offers foundational guides, templates, and step-by-step systems to help you master programmatic SEO and GEO. Explore our free resources and future-proof your SEO today.
Related Articles
Kpis in seo: Essential SEO KPIs That Drive Real Business Results
Key Performance Indicators, or KPIs in SEO, are the handful of numbers that tell you if your strategy is actually working. They’re the bridge between your day-to-day tasks and your big-picture...

Your Guide to KPI in SEO for Sustainable Business Growth
Watching your keyword rankings climb is a great feeling, but let’s be honest—it doesn’t directly pay the bills. The most important KPI in SEO is one that actually tracks real business growth, not...
KPI for SEO: A Practical Guide to the kpi for seo That Drives Growth
Are you actually measuring what matters in your SEO? So many strategies fall flat because they're stuck on old-school metrics like keyword rankings. It's a bit like staring at your car's...