A Practical Guide to Key Performance Indicators for Social Media Growth
Key Performance Indicators (KPIs) for social media aren't just about counting likes and shares. Think of them as the vital signs for your strategy. They are the specific, measurable values that tell you whether your efforts are actually helping your business grow.
What Are Social Media KPIs and Why They Matter
Picture yourself driving a car. Your dashboard is lit up with a speedometer, a fuel gauge, and an engine temperature light. These aren't just random numbers; they are critical indicators telling you about your journey's progress, safety, and efficiency. Social media KPIs do the exact same job for your marketing.
They are the handful of data points you choose to track because they directly reflect your progress towards a specific business goal. To really get it, you have to understand the fundamental meaning of KPI as a concept that goes way beyond just social media.
Without the right KPIs, you’re basically flying blind. You might be celebrating a full tank of fuel (a huge follower count) without realizing your engine is overheating (zero engagement or sales).
Moving Beyond Vanity Metrics
One of the biggest traps people fall into is confusing any old metric with a proper KPI. A "vanity metric" is a number that looks great on a report but offers almost no real strategic value. Follower count is the classic example here.
Sure, having 100,000 followers looks impressive, but what does it actually mean if none of them ever click your links, buy your products, or even talk to you? Not much.
Actionable KPIs, on the other hand, are tied directly to outcomes that matter. They help you answer the tough questions:
- Are we actually reaching the right people?
- Is our content good enough to make someone take action?
- Are we generating real leads or sales from our social channels?
- What’s the actual return on the time and money we’re putting in?
It's helpful to see the difference side-by-side.
Vanity Metrics vs Actionable KPIs
| Metric Type | Example | What It Tells You | Why It's Limited |
|---|---|---|---|
| Vanity | Follower Count | How many people clicked "Follow". | Doesn't measure engagement, loyalty, or purchase intent. |
| Actionable | Engagement Rate per Follower | The percentage of your audience that interacts with your content. | Shows if your content actually resonates with your core audience. |
| Vanity | Post Likes | How many people liked a single post. | It's a low-effort interaction that rarely correlates with business goals. |
| Actionable | Website Clicks from Social | The number of users driven to your website from a post. | Directly measures your ability to convert social attention into traffic. |
| Vanity | Video Views | The number of times a video was played (often for just 3 seconds). | Doesn't tell you if people watched, understood, or valued the content. |
| Actionable | Conversion Rate from Social | The percentage of website visitors from social who complete a goal (e.g., a purchase). | Ties social media activity directly to a core business objective. |
Looking at this, the distinction becomes crystal clear. Actionable KPIs give you insight you can act on, while vanity metrics just puff up your ego.
A KPI isn’t just any number you can measure. It’s the right number that tells you whether your work is actually moving the needle on a real business objective.
Why Every Business Needs Clear KPIs
When you set clear KPIs, your social media efforts stop being a hopeful guessing game and start becoming a predictable, data-driven strategy. Focusing on the right indicators allows you to justify your marketing budget, prove your value to stakeholders, and make much smarter decisions about what to post next.
This focus is everything. Instead of chasing fleeting trends or trying to go viral, your team can concentrate on activities that reliably produce the results you need. For example, if your main KPI is website clicks, you’ll create very different content than if your KPI was brand mentions. This clarity ensures every single post, story, and campaign has a purpose tied to real-world business success.
Connecting Social Media KPIs to Your Business Goals
It’s easy to get lost in social media numbers, but tracking the right numbers is what turns a busy strategy into a profitable one. The most powerful KPIs are always the ones you can trace directly back to your bigger business goals.
Think of it this way: your KPIs are the bridge between your day-to-day social media activity and your company's bottom line.
If your main goal is to drive sales, celebrating a post with a thousand likes but zero clicks to your product page is a classic sign of tracking the wrong thing. This is a trap many fall into, leading to wasted time and budget. The secret is to work backwards. Start with your primary business objective, then pinpoint the specific social metrics that actually measure your progress towards it.
This simple shift in perspective turns social media from a content-publishing chore into a reliable growth engine. Suddenly, every post, campaign, and interaction has a clear purpose, making your efforts accountable and directly tied to real business results.
This diagram perfectly illustrates the difference between a goal-driven KPI and a feel-good vanity metric that ultimately goes nowhere.
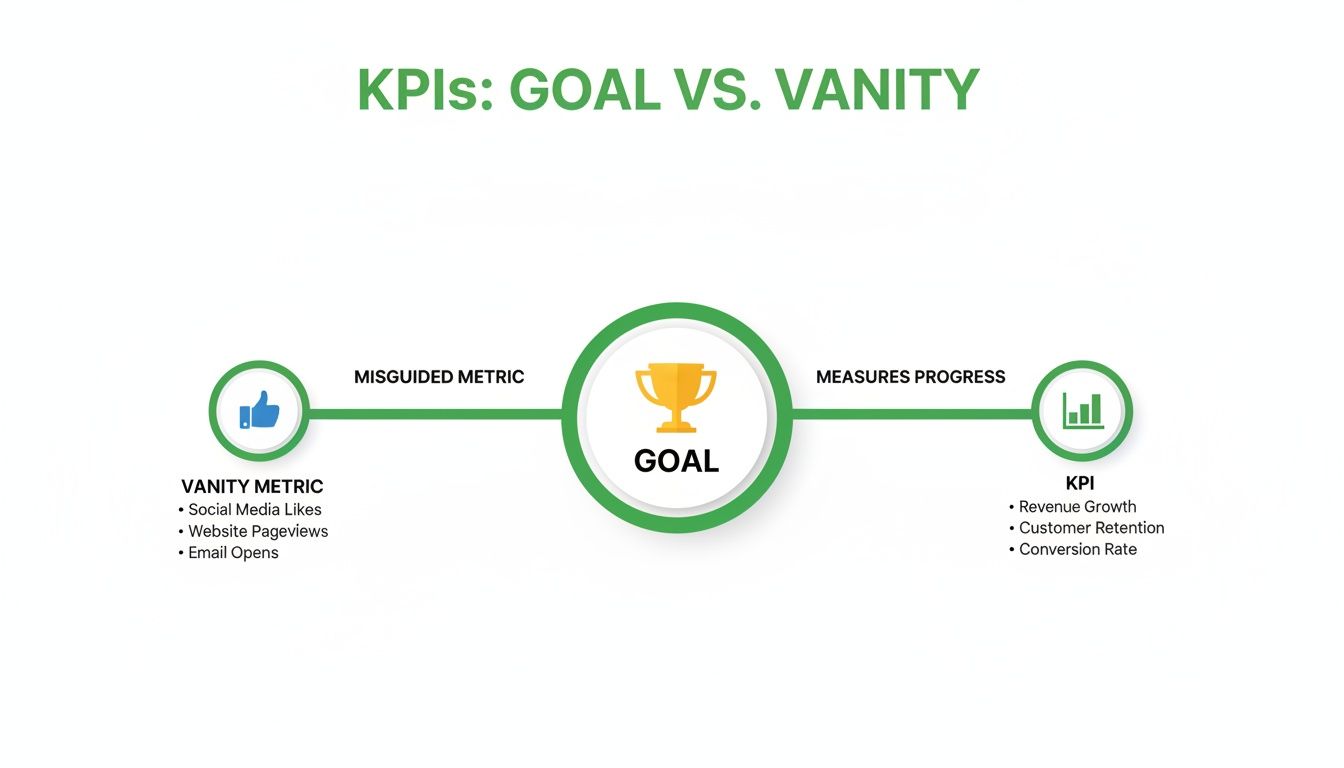
As you can see, true KPIs are always milestones on the path to a tangible goal. Vanity metrics? They're often just a scenic detour.
Mapping KPIs to Business Objectives
So, how do you make this connection practical? It all starts by defining what you want to achieve with your social media efforts. Most business goals fall into a few key categories, and each has its own set of corresponding KPIs.
The table below breaks down this relationship, providing a clear roadmap for connecting your actions to your outcomes.
| Business Goal | Campaign Objective | Primary KPIs | Example Measurement |
|---|---|---|---|
| Increase Brand Awareness | Reach a new target audience and build brand recognition. | Reach, Impressions, Audience Growth Rate, Brand Mentions | "Increase our Instagram reach by 20% quarter-over-quarter." |
| Generate Leads | Drive qualified traffic from social media to a website or landing page. | Click-Through Rate (CTR), Conversion Rate (Form Fills), Cost Per Lead (CPL) | "Achieve a CPL of under €25 for our LinkedIn lead gen campaign." |
| Drive Online Sales | Convert social media followers into paying customers. | Sales Conversion Rate, Average Order Value (AOV), Return on Ad Spend (ROAS) | "Generate a 4:1 ROAS on our Facebook Ads for the new product launch." |
| Improve Customer Loyalty | Nurture the existing community and encourage repeat business. | Engagement Rate, Customer Satisfaction (CSAT), Repeat Customer Rate | "Boost our average post engagement rate to 5% to foster community." |
By using a framework like this, you ensure every metric you track is a deliberate choice, not just a number on a dashboard. It’s about measuring what matters.
A Deeper Dive Into Common Goals
Let's unpack a few of these common goals to see how the KPIs work in the real world.
Goal 1: Increase Brand Awareness
If you’re a new brand or pushing into a new market, your top priority is simply getting on people's radar. You need more of your target audience to know you exist. Here, you're measuring visibility and audience size.
- Reach: The total number of unique people who saw your post.
- Impressions: The total number of times your content was displayed. One person can generate multiple impressions.
- Audience Growth Rate: How quickly your follower count is increasing, showing sustained interest.
Goal 2: Generate Qualified Leads
Now we shift from just being seen to inspiring action. The goal here is to identify potential customers and pull them into your sales funnel. Your KPIs must track how well you move users from a social platform to your own digital turf.
- Click-Through Rate (CTR): The percentage of people who saw your post and actually clicked the link. A vital health check for your creative and call-to-action.
- Conversion Rate: The percentage of those clicks that result in a desired action, like filling out a form or downloading a guide. For a much deeper look into tracking this, check out our guide on attribution modelling.
- Cost Per Lead (CPL): For paid ads, this is your bottom-line number. How much are you spending to get one new lead in the door?
Goal 3: Drive Online Sales
For e-commerce, the line between social media and revenue needs to be rock solid. Success isn't about likes; it's about completed checkouts.
- Sales Conversion Rate: The ultimate metric. Of all the people who clicked from social, how many actually bought something?
- Average Order Value (AOV): How much, on average, are customers from social channels spending per purchase?
- Return on Ad Spend (ROAS): Your key profitability metric for paid campaigns. For every euro you put in, how many did you get back in revenue?
Goal 4: Improve Customer Loyalty and Advocacy
Remember, your happiest customers are your best marketers. This goal is all about nurturing your existing community and turning them into vocal brand fans.
- Engagement Rate: The percentage of your audience that actively likes, comments, and shares your content. It’s a measure of community health.
- Customer Satisfaction (CSAT): Often measured with simple polls or surveys, this tracks how happy people are with your social media support and interaction.
- Brand Mentions: Keeping an eye on how often people are talking about your brand organically, without being prompted.
By carefully choosing KPIs that align with your specific business goals, you guarantee that every minute and every euro you spend on social media contributes directly to meaningful, measurable growth.
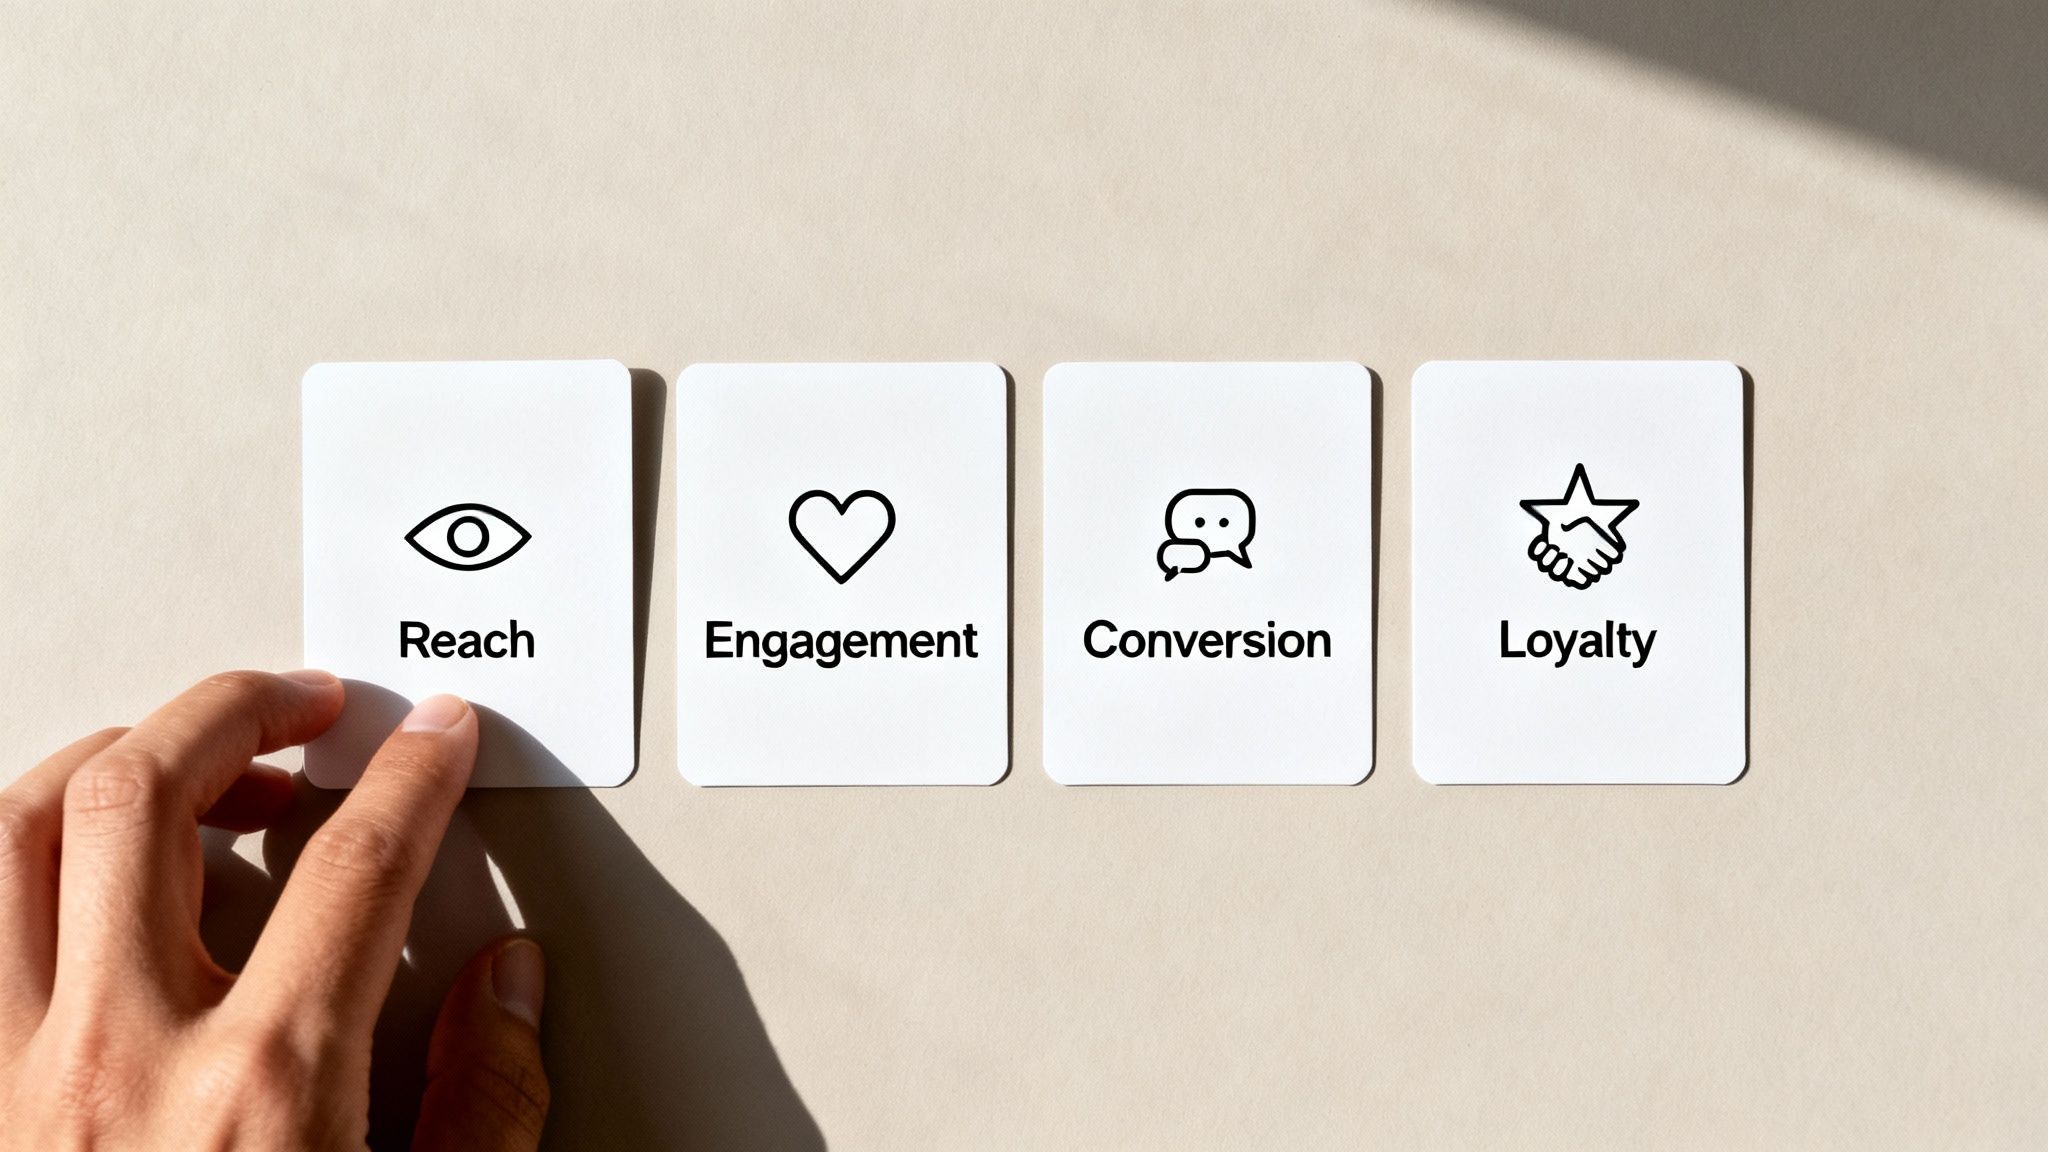
The Four Essential Categories of Social Media KPIs
Trying to track every single metric social media throws at you is a fast track to getting completely overwhelmed. It’s data overload.
To cut through the noise, it's far better to group your key performance indicators (KPIs) into four simple, logical categories. Each one tells a distinct part of your brand's story.
Think of it like reading a book. You can't just skip to the final page and claim you understand the plot. You have to follow the whole narrative—from how many people you initially reached, to how they engaged, whether they converted, and ultimately, if they became loyal fans.
This organised approach stops you from drowning in spreadsheets and forces you to focus on the numbers that actually connect to your business goals.
1. Reach KPIs: How Many People See Your Content
Reach is the first, most fundamental step in any social media funnel. These KPIs tell you just how big your potential audience is and how effectively your content is spreading. It's all about visibility.
Are people even seeing what you post? Without reach, none of the other metrics even have a chance to get off the ground.
Key examples of Reach KPIs include:
- Impressions: This is the total number of times your content was displayed on a screen. One person could see your post five times, which counts as five impressions.
- Reach: This is the total number of unique individuals who saw your content. It’s a much cleaner metric than impressions for understanding the true size of your audience.
- Audience Growth Rate: This measures the speed at which you’re gaining new followers, giving you a clear signal if your brand's presence is expanding or stagnating.
The sheer scale of social media makes reach a vital starting point. For instance, in January 2025, Germany had 65.5 million active social media user identities. This KPI shows a penetration of 77.6% of the total population—and while that's a slight dip of 2.3 million users (3.4%) from early 2024, it still highlights social media's dominance. Figures like these, available on DataReportal, show why ignoring these platforms isn't an option.
2. Engagement KPIs: Who Interacts With Your Content
Once you’ve reached an audience, the next logical question is: do they actually care? Engagement KPIs measure the interactions your content gets, showing you whether your message is truly resonating.
High engagement is the sign of a healthy, interested community. It’s the difference between speaking at people and speaking with them.
Important Engagement KPIs are:
- Likes, Comments, and Shares: The classic signs of interaction. Comments are especially valuable because they require more effort and often spark a real conversation.
- Saves: When a user saves your post, it's a huge signal that they found it valuable enough to revisit later.
- Engagement Rate: This is arguably the most important engagement KPI. It calculates the percentage of your audience that interacted with a post. The formula is simple: (Total Engagements ÷ Total Followers) x 100.
A high engagement rate tells you that you’re not just shouting into the void. It proves you're building a real connection with your audience, which is the foundation for turning followers into customers.
3. Conversion KPIs: Who Takes Action
This is where your social media activity starts to connect directly to your bottom line. Conversion KPIs track how well you persuade users to take a specific, desired action—like visiting your website, signing up for a newsletter, or making a purchase.
These are the metrics that demonstrate a clear return on investment.
Essential Conversion KPIs to track:
- Click-Through Rate (CTR): This measures the percentage of people who saw your post and actually clicked the link inside it. A low CTR might mean your call-to-action is weak or your creative isn't compelling enough. Learning how to improve your click-through rate is a core skill for any marketer.
- Conversion Rate: This takes CTR one step further. It measures the percentage of users who clicked the link and then completed the desired action on your website (e.g., filled out a form or bought a product).
- Cost Per Click (CPC): For any paid campaigns, this tells you exactly how much you’re paying for each click. It’s essential for managing your advertising budget effectively.
4. Loyalty KPIs: Who Becomes a Brand Advocate
The final category focuses on the long game. Loyalty and advocacy KPIs measure the health of your brand and the strength of your community over time. These metrics help you understand if you’re building a base of genuine fans who will support and promote you organically.
It's about turning one-time customers into a lasting community.
Key Loyalty KPIs include:
- Brand Mentions: This tracks how often people are talking about your brand online without being prompted. It’s a fantastic measure of organic brand awareness and sentiment.
- Customer Testimonials and Reviews: Positive reviews shared on social media are powerful social proof. Tracking these gives you a source of valuable user-generated content and deep insights.
- Net Promoter Score (NPS): While not exclusively a social media metric, you can easily use social polls or surveys to ask your audience how likely they are to recommend your brand, giving you a quick pulse on customer loyalty.
By organising your KPIs into these four categories—Reach, Engagement, Conversion, and Loyalty—you create a clear, actionable framework for measuring what truly matters.
How to Track and Measure Your Social Media KPIs
Knowing which social media KPIs to track is one thing. Actually measuring them is where the theory gets real. Luckily, you don’t need a data science degree or a complex suite of software to get started. A simple, effective tracking system is completely within your reach.
The journey from a raw number to a real insight starts with knowing where to find the data. This all comes down to effective social media monitoring, which is really just the practice of gathering the information you need to measure your KPIs. Let's break down the most practical ways to do this.

Start With Built-In Platform Analytics
Every major social media platform gives you its own free, built-in analytics dashboard. This is ground zero for data collection and, honestly, it's surprisingly powerful for day-to-day tracking. It’s the perfect place to find your Reach, Engagement, and Follower Growth KPIs.
- Meta Business Suite (Facebook & Instagram): This is your hub for tracking post reach, impressions, engagement rates, and video views across both platforms. It clearly shows which content formats are hitting the mark.
- LinkedIn Analytics: Found right on your Company Page, this tool gives you detailed insights into your visitor demographics, post performance (including click-through rates), and follower growth.
- TikTok Analytics: Accessible from your profile, this dashboard offers up crucial data on video views, profile views, follower trends, and even the exact times your audience is most active.
These native tools are fantastic for understanding what’s happening within each platform. The big limitation, though, is that they can't tell you what happens after someone clicks a link and leaves the app.
Demystify UTM Parameters for Deeper Tracking
This is where you connect the dots between your social media activity and actual website results. UTM parameters might sound a bit technical, but the concept is dead simple.
Think of a UTM parameter as a unique name tag you attach to every link you share on social media. When someone clicks that link and lands on your website, this "name tag" tells your analytics software exactly where they came from.
This is the absolute key to measuring your Conversion KPIs, like click-through rates and sales driven by social media. Without them, all your social traffic just gets dumped into a generic "social" bucket, leaving you clueless about which specific post, campaign, or platform actually drove the visit.
You can create these tagged links in seconds using a free UTM builder tool. You just need to specify a few key details:
- Campaign Source: The platform where you’re sharing the link (e.g.,
facebook,linkedin). - Campaign Medium: The type of marketing channel (e.g.,
social,cpc). - Campaign Name: A specific name for your campaign (e.g.,
spring-sale-2025).
Once a user clicks a UTM-tagged link, you’ll see this precise data pop up in your website analytics. Understanding these parameters is fundamental, especially for mastering tools like Google Analytics 4. You can learn more about getting the most from your data in our detailed guide on setting up and using Google Analytics 4.
Use Dashboard Tools to Centralise Your Data
Logging into five different analytics dashboards every week is a huge time-sink. It’s inefficient and makes it hard to see the big picture. This is where third-party social media management tools like Hootsuite or Buffer become incredibly valuable.
These tools act as a central command centre. They connect to all your social accounts and pull your KPIs into a single, unified dashboard. This not only saves a massive amount of time but also makes it much easier to compare performance across different channels side-by-side. You can see your total follower growth, overall engagement rate, and top-performing posts across all networks in one view, which makes reporting a breeze.
Building a Simple and Effective KPI Dashboard
Tracking individual KPIs is one thing, but seeing them all together in one place? That’s where you find the real story. A great dashboard isn’t some complex spreadsheet designed to drown you in numbers; it’s a storytelling tool. It should tell you, at a glance, if your strategy is actually working and where you need to focus your attention next.
The goal is to move beyond an endless stream of data points and create a clear, visual summary of your performance. Think of it as your mission control, helping you consistently see what’s landing, spot opportunities, and make smarter, data-backed decisions about where to invest your time and budget.
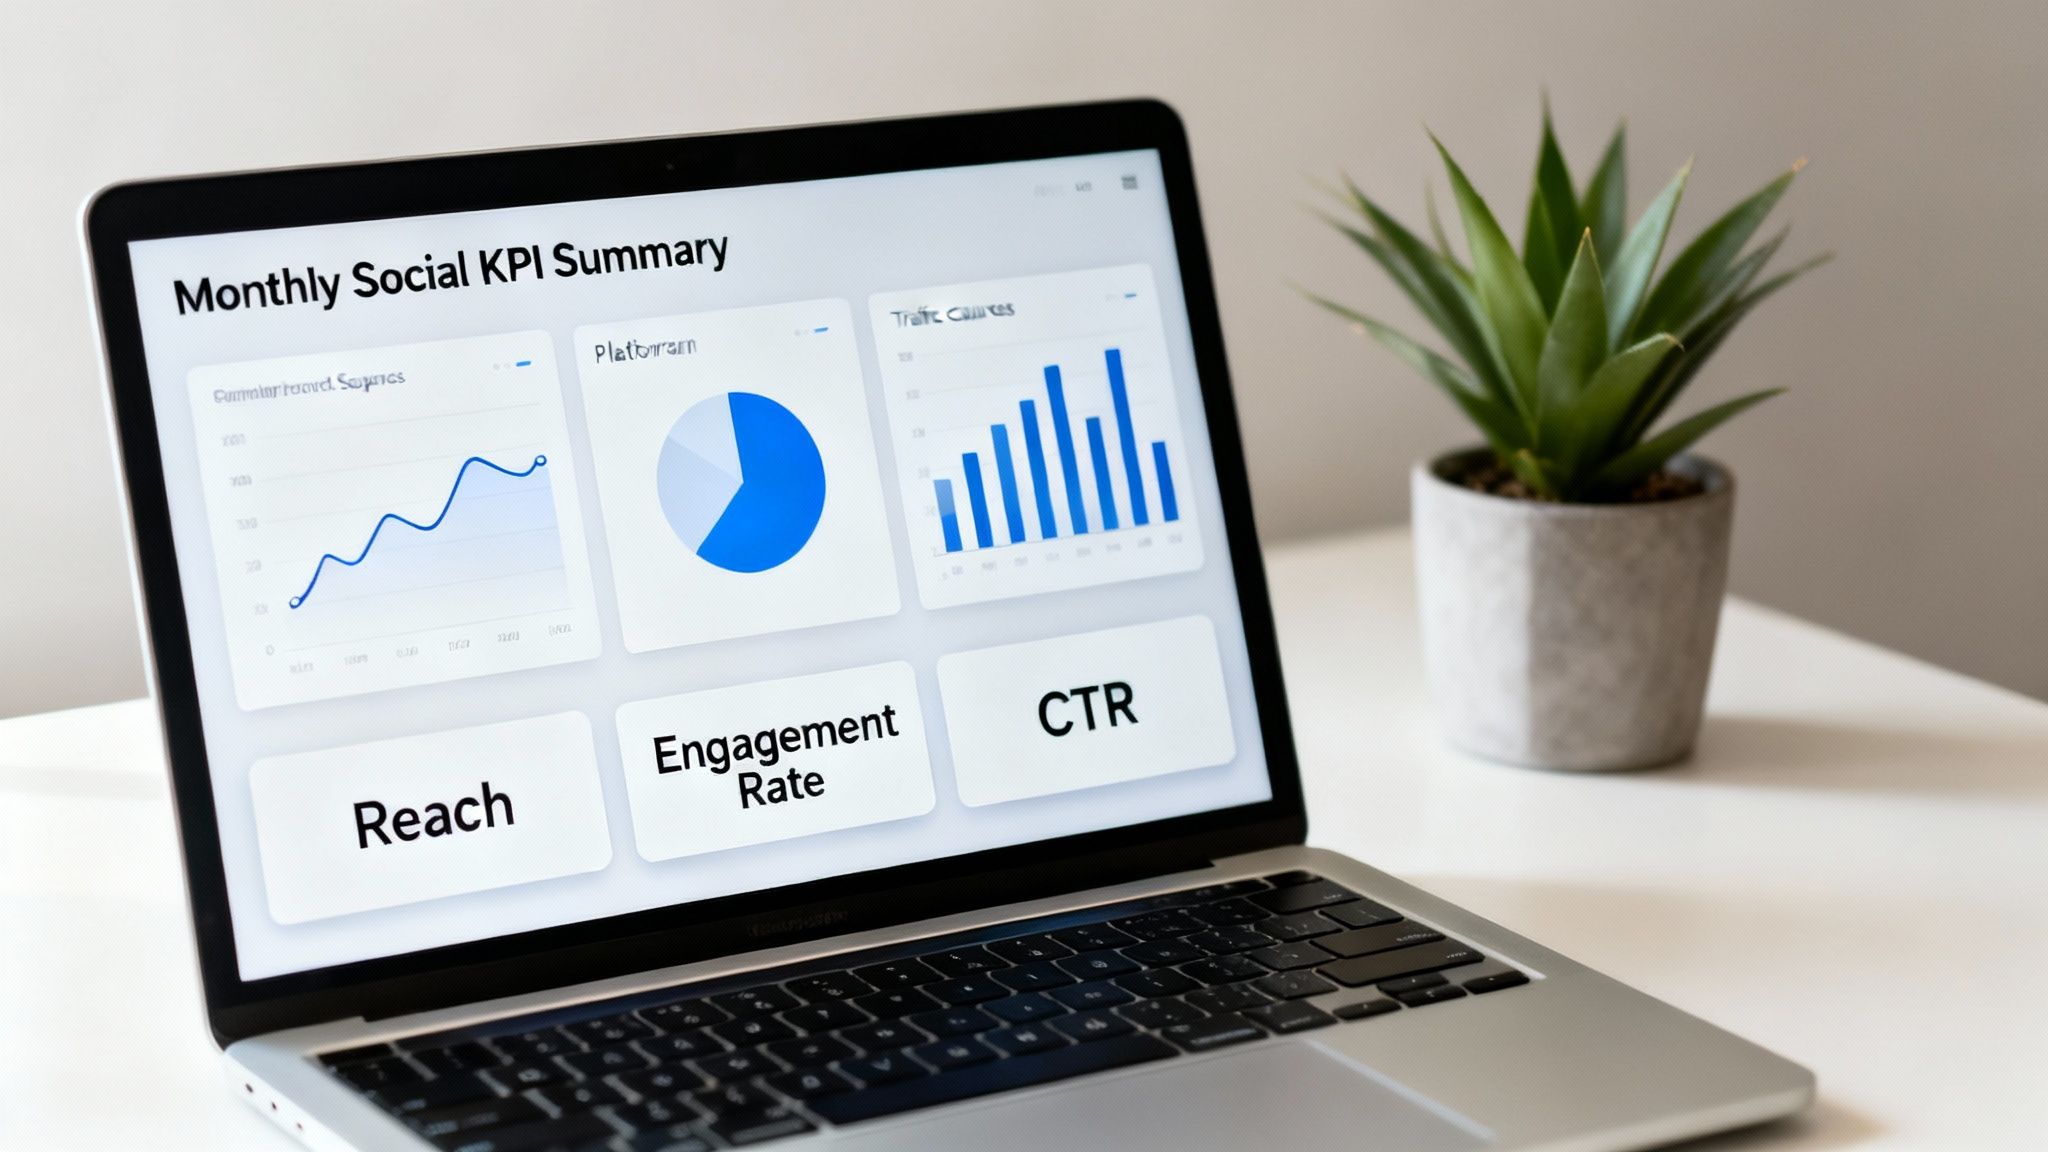
This screenshot shows a clean dashboard that organises key metrics visually, making performance trends easy to understand instantly.
Structuring Your Dashboard for Clarity
A common mistake is trying to build a one-size-fits-all dashboard. The truth is, different people in your organisation need different levels of detail. An effective dashboard is structured for its audience, communicating progress without causing confusion.
I find it helpful to think of it in two layers:
- The Executive Summary: This is the high-level overview for leadership. It focuses squarely on bottom-line metrics tied directly to business goals, like Return on Ad Spend (ROAS), Cost Per Lead (CPL), and total website conversions driven by social media.
- The Team Deep Dive: This one’s for the marketing team on the ground. It gets into the granular, platform-specific KPIs like Engagement Rate, Click-Through Rate (CTR), Audience Growth Rate, and which pieces of content are performing best.
This layered approach ensures everyone gets the information they need without being overwhelmed by data that isn't relevant to them. Your CEO can see the business impact in 60 seconds, while your social media manager has the detailed metrics needed to fine-tune day-to-day tactics.
Choosing Your Dashboard Tool
You don’t need to splash out on expensive software to build a powerful dashboard. For many, a simple, well-organised spreadsheet is more than enough to get started.
A dashboard's value isn't in the software used to build it, but in the clarity it provides. The best tool is the one you will actually use consistently to track progress and make decisions.
Here are a few popular options to consider:
- Google Sheets or Microsoft Excel: They’re free, flexible, and surprisingly powerful. You can manually input data weekly or monthly and use the built-in charting tools to visualise trends automatically. Perfect for small teams or if you're just starting out.
- Looker Studio (formerly Google Data Studio): This is a fantastic free tool that can connect directly to data sources like Google Analytics and platform ad managers. It pulls in data automatically, creating live dashboards that update in real-time.
- Third-Party Tools (e.g., Hootsuite, Sprout Social): Most social media management platforms come with built-in analytics and reporting features that create dashboards for you. These are great for saving time and keeping all your data in one place.
The principles behind building effective SEO dashboards are very similar—it all comes down to clarity and tying metrics back to your core objectives.
Essential Elements of a Social Media KPI Dashboard
No matter which tool you land on, your dashboard needs a few essential components to be genuinely useful. Make sure it has separate sections for each of your main social platforms (e.g., a tab for Instagram, another for LinkedIn).
Within each section, organise your KPIs by the four categories we’ve already discussed: Reach, Engagement, Conversion, and Loyalty. For each KPI, track its value for the current period (like this month), the previous period, and the percentage change between them. This context is crucial for understanding whether you’re improving, declining, or holding steady.
Finally, always include charts that automatically plot your key metrics over time. This makes trends impossible to miss and turns a static report into a dynamic guide for your strategy.
Turning Your Data into Smarter Decisions
Collecting social media KPIs is only half the job. The real magic happens when you start using that data to make better, faster decisions.
Think of your KPIs as signals from your audience. Learning to read them is what shifts your strategy from pure guesswork to a predictable engine for growth. This data isn't just for a report you glance at once a month; it’s a compass that should guide what you do every single day.
What Your KPIs Are Really Telling You
Your metrics tell a story about what your audience craves, what grabs their attention, and what finally convinces them to act.
When a number looks off, it’s not a failure. It’s a clue. It’s pointing you directly to a problem you can fix. Let’s walk through a couple of common scenarios you’ll definitely run into.
Scenario 1: High Reach, Low Engagement
- What it means: A ton of people are seeing your content, but almost no one is bothering to interact. Your message is being broadcast, but it's not actually connecting with anyone.
- What to do: This is a huge red flag that your content format needs a rethink. If all you’re posting are slick promotional graphics, it’s time to experiment. Try some behind-the-scenes video, run an interactive poll in your Stories, or feature content from your own customers.
Scenario 2: Great Click-Through Rate, Poor Conversions
- What it means: Congratulations, your social media post is working perfectly! The hook, the visual, and the call-to-action were compelling enough to earn the click. The breakdown is happening after they leave social media.
- What to do: Don't change your social strategy—it's clearly working. Instead, put all your energy into optimising the landing page. Check its loading speed, make the headline crystal clear, simplify any forms, and make damn sure the offer on the page is the exact same one you promised in the post.
The whole point is to build a continuous feedback loop: test something, measure the result, learn from it, and then optimise your next move. This is the process that drives real, consistent improvement.
Get Used to Testing Everything
The only way to find out what actually works is to test it.
A/B testing (or split testing) is just a simple way of comparing two versions of the same thing to see which one performs better. It takes all the guesswork and ego out of your decisions and lets your audience’s behaviour tell you what they prefer.
You can—and should—test everything:
- Headlines: Does a question work better than a bold statement? Test it.
- Visuals: Pit a polished stock photo against a custom-made graphic. See what wins.
- Calls-to-Action (CTAs): Compare how many people click "Learn More" versus "Shop Now". The answer might surprise you.
By constantly testing and refining, you build a much deeper, more intuitive understanding of what makes your audience tick. Your efforts get sharper and more effective over time, which is exactly how you start proving a real return on your investment.
To go deeper on that last point, check out our complete guide on social media ROI calculation.
FAQs: Your Social Media KPI Questions Answered
Diving into social media KPIs always brings up a few common questions. Let's clear them up so you can get back to building a solid, data-backed strategy.
How Often Should I Be Checking My Social Media KPIs?
Honestly, it depends entirely on who’s looking at the data. Think of it in layers.
Your social media team, the ones in the trenches, should be checking performance metrics almost daily, or at the very least, weekly. This is all about spotting trends and optimising campaigns in real-time. It’s how you catch a post that’s flopping and pivot quickly.
For management or key stakeholders, a monthly report usually hits the sweet spot. It gives enough time for real trends to emerge and keeps the focus on the big picture—how is social actually contributing to business goals like leads and sales? Then, a quarterly review is perfect for making those bigger strategic calls on budget and which platforms to double down on.
What Are The Most Important KPIs For An E-commerce Business?
If you're in e-commerce, your focus has to be ruthless: metrics that tie directly to revenue and customer acquisition. Sure, reach and engagement are nice, but they're support acts to the main event.
The KPIs that truly matter are:
- Sales Conversion Rate: Out of all the people who clicked a link from social media, what percentage actually bought something? This is your bottom line.
- Return on Ad Spend (ROAS): For every euro you pump into social ads, how many euros in revenue do you get back? This tells you if your ads are profitable.
- Average Order Value (AOV): How much are the customers coming from social media spending on average? A great indicator of customer quality.
- Click-Through Rate (CTR): This is your first hurdle. It measures how good your social posts are at getting people to even click through to your product pages.
How Do Social Media KPIs Actually Affect SEO?
It’s easy to think of social media and SEO as two separate worlds, but they're more connected than you might think. A strong social media game sends a lot of positive signals to search engines, giving your rankings an indirect but valuable boost.
It works in a few ways. First, when your content gets high engagement and shares on social, it puts it in front of more people. More eyeballs mean a higher chance of someone linking back to your content, building those all-important backlinks.
Second, social media drives referral traffic straight to your website. When those visitors stick around, it signals to Google that your site has quality content people find useful. Finally, think of your social channels as a massive distribution network. They get your articles and blog posts seen, shared, and discovered, accelerating the whole SEO process.
Ready to scale your content and dominate search rankings? At Programmatic SEO Hub, we provide the guides, tools, and strategies you need to master AI-driven SEO. Explore our resources and start building your content engine today at https://programmatic-seo-hub.com/en.
Related Articles
10 Social Media Key Performance Indicators to Master in 2025
Are you drowning in social media data but starving for real insights? In a world of vanity metrics like follower counts, identifying the right social media key performance indicators (KPIs) is the...